Data Science - Python DataFrame
Create a DataFrame with Pandas
A data frame is a structured representation of data.
Let's define a data frame with 3 columns and 5 rows with fictional numbers:
Example
import pandas as pd
d = {'col1': [1, 2, 3, 4, 7], 'col2': [4, 5, 6, 9,
5], 'col3': [7, 8, 12, 1, 11]}
df = pd.DataFrame(data=d)
print(df)
Try it Yourself »
Example Explained
- Import the Pandas library as pd
- Define data with column and rows in a variable named d
- Create a data frame using the function pd.DataFrame()
- The data frame contains 3 columns and 5 rows
- Print the data frame output with the print() function
We write pd. in front of DataFrame() to let Python know that we want to activate the DataFrame() function from the Pandas library.
Be aware of the capital D and F in DataFrame!
Interpreting the Output
This is the output:
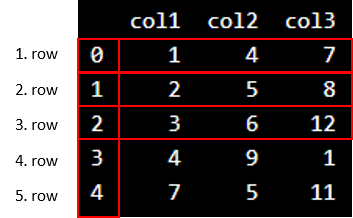
We see that "col1", "col2" and "col3" are the names of the columns.
Do not be confused about the vertical numbers ranging from 0-4. They tell us the information about the position of the rows.
In Python, the numbering of rows starts with zero.
Now, we can use Python to count the columns and rows.
We can use df.shape[1] to find the number of columns:
Example
Count the number of columns:
count_column = df.shape[1]
print(count_column)
Try it Yourself »
We can use df.shape[0] to find the number of rows:
Why Can We Not Just Count the Rows and Columns Ourselves?
If we work with larger data sets with many columns and rows, it will be confusing to count it by yourself. You risk to count it wrongly. If we use the built-in functions in Python correctly, we assure that the count is correct.
