Data Science - Regression Table
Regression Table
The output from linear regression can be summarized in a regression table.
The content of the table includes:
- Information about the model
- Coefficients of the linear regression function
- Regression statistics
- Statistics of the coefficients from the linear regression function
- Other information that we will not cover in this module
Regression Table with Average_Pulse as Explanatory Variable
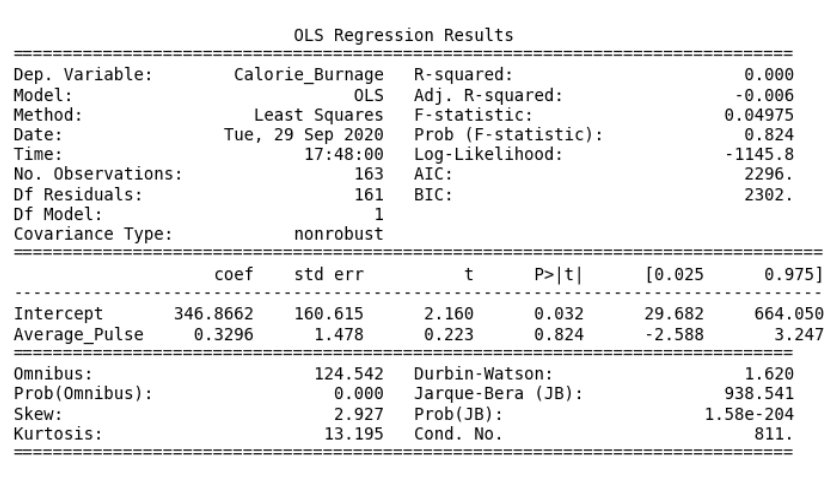
You can now begin your journey on analyzing advanced output!
Create a Linear Regression Table in Python
Here is how to create a linear regression table in Python:
Example
import pandas as pd
import statsmodels.formula.api as smf
full_health_data = pd.read_csv("data.csv", header=0, sep=",")
model = smf.ols('Calorie_Burnage ~ Average_Pulse', data =
full_health_data)
results = model.fit()
print(results.summary())
Try it Yourself »
Example Explained:
- Import the library statsmodels.formula.api as smf. Statsmodels is a statistical library in Python.
- Use the full_health_data set.
- Create a model based on Ordinary Least Squares with smf.ols(). Notice that the explanatory variable must be written first in the parenthesis. Use the full_health_data data set.
- By calling .fit(), you obtain the variable results. This holds a lot of information about the regression model.
- Call summary() to get the table with the results of linear regression.
