Data Science - Linear Functions
Mathematical functions are important to know as a data scientist, because we want to make predictions and interpret them.
Linear Functions
In mathematics a function is used to relate one variable to another variable.
Suppose we consider the relationship between calorie burnage and average pulse. It is reasonable to assume that, in general, the calorie burnage will change as the average pulse changes - we say that the calorie burnage depends upon the average pulse.
Furthermore, it may be reasonable to assume that as the average pulse increases, so will the calorie burnage. Calorie burnage and average pulse are the two variables being considered.
Because the calorie burnage depends upon the average pulse, we say that calorie burnage is the dependent variable and the average pulse is the independent variable.
The relationship between a dependent and an independent variable can often be expressed mathematically using a formula (function).
A linear function has one independent variable (x) and one dependent variable (y), and has the following form:
y = f(x) = ax + b
This function is used to calculate a value for the dependent variable when we choose a value for the independent variable.
Explanation:
- f(x) = the output (the dependant variable)
- x = the input (the independant variable)
- a = slope = is the coefficient of the independent variable. It gives the rate of change of the dependent variable
- b = intercept = is the value of the dependent variable when x = 0. It is also the point where the diagonal line crosses the vertical axis.
Linear Function With One Explanatory Variable
A function with one explanatory variable means that we use one variable for prediction.
Let us say we want to predict calorie burnage using average pulse. We have the following formula:
f(x) = 2x + 80
Here, the numbers and variables means:
- f(x) = The output. This number is where we get the predicted value of Calorie_Burnage
- x = The input, which is Average_Pulse
- 2 = Slope = Specifies how much Calorie_Burnage increases if Average_Pulse increases by one. It tells us how "steep" the diagonal line is
- 80 = Intercept = A fixed value. It is the value of the dependent variable when x = 0
Plotting a Linear Function
The term linearity means a "straight line". So, if you show a linear function graphically, the line will always be a straight line. The line can slope upwards, downwards, and in some cases may be horizontal or vertical.
Here is a graphical representation of the mathematical function above:
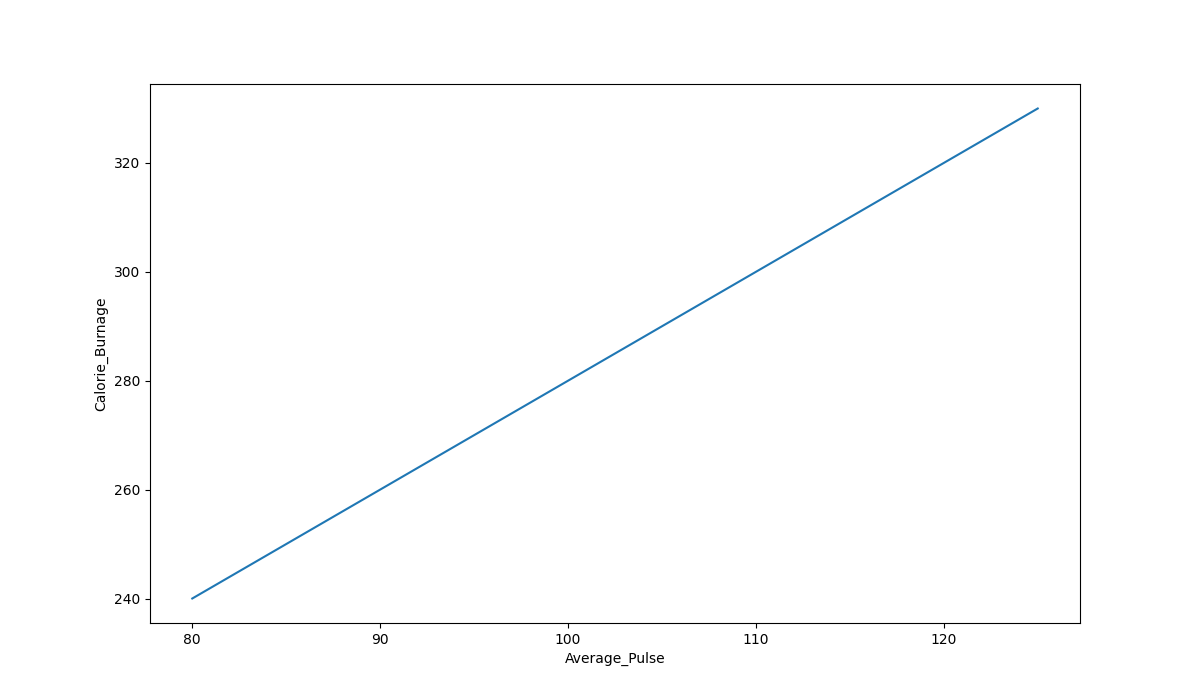
Graph Explanations:
- The horizontal axis is generally called the x-axis. Here, it represents Average_Pulse.
- The vertical axis is generally called the y-axis. Here, it represents Calorie_Burnage.
- Calorie_Burnage is a function of Average_Pulse, because Calorie_Burnage is assumed to be dependent on Average_Pulse.
- In other words, we use Average_Pulse to predict Calorie_Burnage.
- The blue (diagonal) line represents the structure of the mathematical function that predicts calorie burnage.
