Data Science - Slope and Intercept
Slope and Intercept
Now we will explain how we found the slope and intercept of our function:
f(x) = 2x + 80
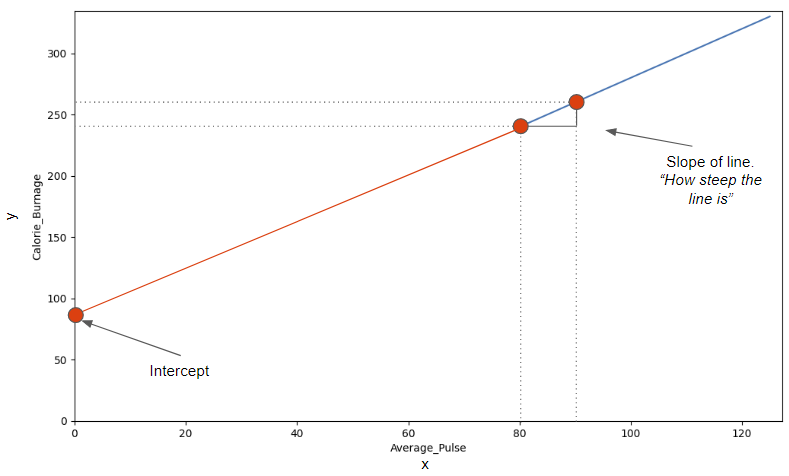
The image below points to the Slope - which indicates how steep the line is, and the Intercept - which is the value of y, when x = 0 (the point where the diagonal line crosses the vertical axis). The red line is the continuation of the blue line from previous page.
Find The Slope
The slope is defined as how much calorie burnage increases, if average pulse increases by one. It tells us how "steep" the diagonal line is.
We can find the slope by using the proportional difference of two points from the graph.
- If the average pulse is 80, the calorie burnage is 240
- If the average pulse is 90, the calorie burnage is 260
We see that if average pulse increases with 10, the calorie burnage increases by 20.
Slope = 20/10 = 2
The slope is 2.
Mathematically, Slope is Defined as:
Slope = f(x2) - f(x1) / x2-x1
f(x2) = Second observation of Calorie_Burnage = 260
f(x1) = First
observation of Calorie_Burnage = 240
x2 = Second observation of Average_Pulse = 90
x1 = First observation of
Average_Pulse = 80
Slope = (260-240) / (90 - 80) = 2
Be consistent to define the observations in the correct order! If not, the prediction will not be correct!
Use Python to Find the Slope
Calculate the slope with the following code:
Example
def slope(x1, y1, x2, y2):
s = (y2-y1)/(x2-x1)
return s
print (slope(80,240,90,260))
Try it Yourself »
Find The Intercept
The intercept is used to fine tune the functions ability to predict Calorie_Burnage.
The intercept is where the diagonal line crosses the y-axis, if it were fully drawn.
The intercept is the value of y, when x = 0.
Here, we see that if average pulse (x) is zero, then the calorie burnage (y) is 80.
So, the intercept is 80.
Sometimes, the intercept has a practical meaning. Sometimes not.
Does it make sense that average pulse is zero?
No, you would be dead and you certainly would not burn any calories.
However, we need to include the intercept in order to complete the mathematical function's ability to predict Calorie_Burnage correctly.
Other examples where the intercept of a mathematical function can have a practical meaning:
- Predicting next years revenue by using marketing expenditure (How much revenue will we have next year, if marketing expenditure is zero?). It is likely to assume that a company will still have some revenue even though if it does not spend money on marketing.
- Fuel usage with speed (How much fuel do we use if speed is equal to 0 mph?). A car that uses gasoline will still use fuel when it is idle.
Find the Slope and Intercept Using Python
The np.polyfit() function returns the slope and intercept.
If we proceed with the following code, we can both get the slope and intercept from the function.
Example
import numpy as np
health_data = pd.read_csv("data.csv", header=0, sep=",")
x = health_data["Average_Pulse"]
y = health_data["Calorie_Burnage"]
slope_intercept = np.polyfit(x,y,1)
print(slope_intercept)
Try it Yourself »
Example Explained:
- Isolate the variables Average_Pulse (x) and Calorie_Burnage (y) from health_data.
- Call the np.polyfit() function.
- The last parameter of the function specifies the degree of the function, which in this case is "1".
Tip: linear functions = 1.degree function. In our example, the function is linear, which is in the 1.degree. That means that all coefficients (the numbers) are in the power of one.
We have now calculated the slope (2) and the intercept (80). We can write the mathematical function as follow:
Predict Calorie_Burnage by using a mathematical expression:
f(x) = 2x + 80
Task:
Now, we want to predict calorie burnage if average pulse is 135.
Remember that the intercept is a constant. A constant is a number that does not change.
We can now substitute the input x with 135:
f(135) = 2 * 135 + 80 = 350
If average pulse is 135, the calorie burnage is 350.
Define the Mathematical Function in Python
Here is the exact same mathematical function, but in Python. The function returns 2*x + 80, with x as the input:
Try to replace x with 140 and 150.
Plot a New Graph in Python
Here, we plot the same graph as earlier, but formatted the axis a little bit.
Max value of the y-axis is now 400 and for x-axis is 150:
Example
import matplotlib.pyplot as plt
health_data.plot(x ='Average_Pulse',
y='Calorie_Burnage', kind='line'),
plt.ylim(ymin=0, ymax=400)
plt.xlim(xmin=0,
xmax=150)
plt.show()
Try it Yourself »
Example Explained
- Import the pyplot module of the matplotlib library
- Plot the data from Average_Pulse against Calorie_Burnage
kind='line'tells us which type of plot we want. Here, we want to have a straight line- plt.ylim() and plt.xlim() tells us what value we want the axis to start and stop on.
- plt.show() shows us the output
