Artificial Intelligence
Statistics
Statistics is about how to collect, analyze, interpret, and present data.
- What is the most Common?
- What is the most Expected?
- What is the most Normal?
Inferential Statistics
Inferential statistics are methods for quantifying properties of a population from a small Sample:
You take data from a sample and make a prediction about the whole population.
For example, you can stand in a shop and ask a sample of 100 people if they like chocolate.
From your research, using inferential statistics, you could predict that 91% of all shoppers like chocolate.
Incredible Chocolate Facts
Nine out of ten people love chocolate.
50% of the US population cannot live without chocolate every day.
Descriptive Statistics
Descriptive Statistics are methods for summarizing observations into information that we can understand.
Since we register every new born baby, we can tell that 51 out of 100 are boys.
From the numbers we have collected, we can predict a 51% chance that a new baby will be a boy.
It is a mystery that the ratio is not 50%, like basic biology would predict. We can only say that we have at least had this tilted sex ratio since the 17th century.
Mean Values
The mean value is the Average of all values.
This table contains house prices versus size:
| Price | 7 | 8 | 8 | 9 | 9 | 9 | 10 | 11 | 14 | 14 | 15 |
| Size | 50 | 60 | 70 | 80 | 90 | 100 | 110 | 120 | 130 | 140 | 150 |
The mean price is (7+8+8+9+9+9+10+11+14+14+15)/11 = 10.363636.
How to: Add all numbers, then divide by the number of numbers.
The Mean is the Sum divided by the Count.
Or if you use a math library like math.js:
var mean = math.mean([7,8,8,9,9,9,10,11,14,14,15]);
The Variance
In statistics, the Variance is the average of the squared differences from the mean value.
In other words, it describes how far a set of numbers is spread out from their average value.
The Variance (in JavaScript):
// Calculate the Mean (m)
var m = (7+8+8+9+9+9+10+11+14+14+15)/11;
// Calculate the Sum of Squares (ss)
var ss = (7-m)**2 + (8-m)**2 + (8-m)**2 + (9-m)**2 + (9-m)**2 + (9-m)**2 + (9-m)**2 + (10-m)**2 + (11-m)**2 + (14-m)**2 + (15-m)**2;
// Calculate the Variance
var variance = ss / 11;
Or if you use a math library like math.js:
var variance = math.variance([7,8,8,9,9,9,10,11,14,14,15],"uncorrected");
Standard Deviation
Standard Deviation is a measure of how spread out numbers are.
The symbol is σ (Greek letter sigma).
The formula is the √ variance (the square root of the variance).
The Standard Deviation is (in JavaScript):
// Calculate the Mean (m)
var m = (7+8+8+9+9+9+10+11+14+15)/11;
// Calculate the Sum of Squares (ss)
var ss = (7-m)**2 + (8-m)**2 + (8-m)**2 + (9-m)**2 + (9-m)**2 + (9-m)**2 + (9-m)**2 + (10-m)**2 + (11-m)**2 + (14-m)**2 + (15-m)**2;
// Calculate the Variance
var variance = ss / 11;
// Calculate the Standard Deviation
var std = Math.sqrt(variance);
Or if you use a math library like math.js:
var std = math.std([7,8,8,9,9,9,9,10,11,14,15],"uncorrected");
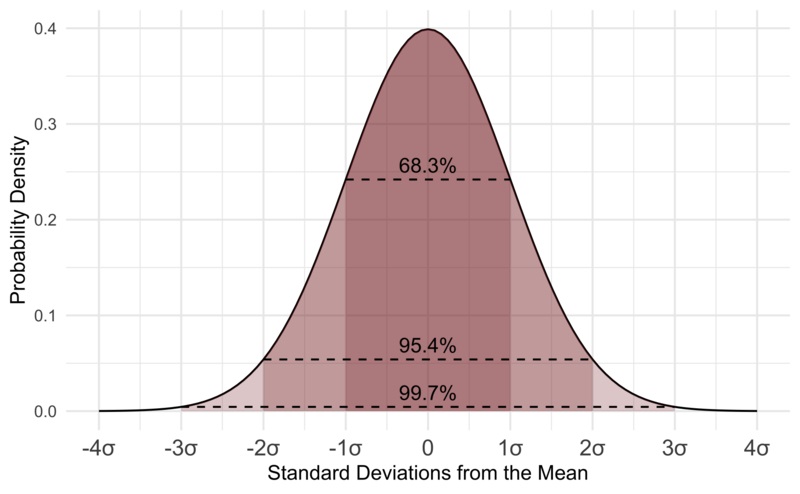
Normal Distribution
The Normal Distribution Curve is a bell-shaped curve.
Each band of the curve has a width 1 Standard Deviation: