Matplotlib Histograms
Histogram
A histogram is a graph showing frequency distributions.
It is a graph showing the number of observations within each given interval.
Example: Say you ask for the height of 250 people, you might end up with a histogram like this:
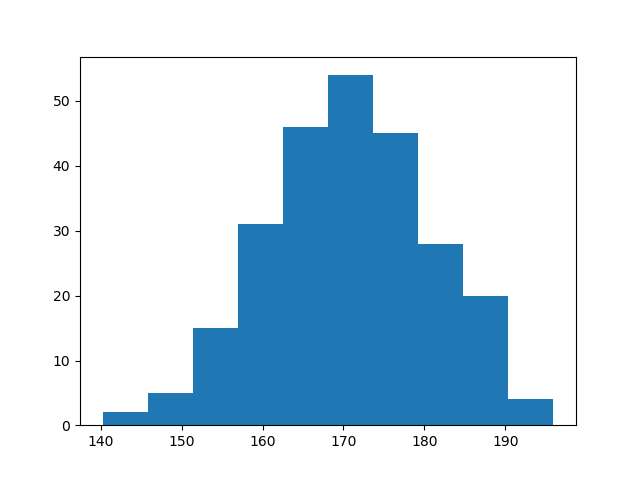
You can read from the histogram that there are approximately:
2 people from 140 to 145cm
5 people from 145 to 150cm
15 people from
151 to 156cm
31 people from 157 to 162cm
46 people from 163 to 168cm
53
people from 168 to 173cm
45 people from 173 to 178cm
28 people from 179 to
184cm
21 people from 185 to 190cm
4 people from 190 to 195cm
Create Histogram
In Matplotlib, we use the hist() function to
create histograms.
The hist() function will use an array of
numbers to create a histogram, the array is sent into the function as an
argument.
For simplicity we use NumPy to randomly generate an array with 250 values, where the values will concentrate around 170, and the standard deviation is 10. Learn more about Normal Data Distribution in our Machine Learning Tutorial.
Example
A Normal Data Distribution by NumPy:
import numpy as np
x =
np.random.normal(170, 10, 250)
print(x)
Result:
This will generate a random result, and could look like this:
  [167.62255766 175.32495609 152.84661337 165.50264047 163.17457988
   162.29867872 172.83638413 168.67303667 164.57361342 180.81120541
   170.57782187 167.53075749 176.15356275 176.95378312 158.4125473
   187.8842668  159.03730075 166.69284332 160.73882029 152.22378865
   164.01255164 163.95288674 176.58146832 173.19849526 169.40206527
   166.88861903 149.90348576 148.39039643 177.90349066 166.72462233
   177.44776004 170.93335636 173.26312881 174.76534435 162.28791953
   166.77301551 160.53785202 170.67972019 159.11594186 165.36992993
   178.38979253 171.52158489 173.32636678 159.63894401 151.95735707
   175.71274153 165.00458544 164.80607211 177.50988211 149.28106703
   179.43586267 181.98365273 170.98196794 179.1093176  176.91855744
   168.32092784 162.33939782 165.18364866 160.52300507 174.14316386
   163.01947601 172.01767945 173.33491959 169.75842718 198.04834503
   192.82490521 164.54557943 206.36247244 165.47748898 195.26377975
   164.37569092 156.15175531 162.15564208 179.34100362 167.22138242
   147.23667125 162.86940215 167.84986671 172.99302505 166.77279814
   196.6137667  159.79012341 166.5840824  170.68645637 165.62204521
   174.5559345  165.0079216  187.92545129 166.86186393 179.78383824
   161.0973573  167.44890343 157.38075812 151.35412246 171.3107829
   162.57149341 182.49985133 163.24700057 168.72639903 169.05309467
   167.19232875 161.06405208 176.87667712 165.48750185 179.68799986
   158.7913483  170.22465411 182.66432721 173.5675715  176.85646836
   157.31299754 174.88959677 183.78323508 174.36814558 182.55474697
   180.03359793 180.53094948 161.09560099 172.29179934 161.22665588
   171.88382477 159.04626132 169.43886536 163.75793589 157.73710983
   174.68921523 176.19843414 167.39315397 181.17128255 174.2674597
   186.05053154 177.06516302 171.78523683 166.14875436 163.31607668
   174.01429569 194.98819875 169.75129209 164.25748789 180.25773528
   170.44784934 157.81966006 171.33315907 174.71390637 160.55423274
   163.92896899 177.29159542 168.30674234 165.42853878 176.46256226
   162.61719142 166.60810831 165.83648812 184.83238352 188.99833856
   161.3054697  175.30396693 175.28109026 171.54765201 162.08762813
   164.53011089 189.86213299 170.83784593 163.25869004 198.68079225
   166.95154328 152.03381334 152.25444225 149.75522816 161.79200594
   162.13535052 183.37298831 165.40405341 155.59224806 172.68678385
   179.35359654 174.19668349 163.46176882 168.26621173 162.97527574
   192.80170974 151.29673582 178.65251432 163.17266558 165.11172588
   183.11107905 169.69556831 166.35149789 178.74419135 166.28562032
   169.96465166 178.24368042 175.3035525  170.16496554 158.80682882
   187.10006553 178.90542991 171.65790645 183.19289193 168.17446717
   155.84544031 177.96091745 186.28887898 187.89867406 163.26716924
   169.71242393 152.9410412  158.68101969 171.12655559 178.1482624
   187.45272185 173.02872935 163.8047623  169.95676819 179.36887054
   157.01955088 185.58143864 170.19037101 157.221245   168.90639755
   178.7045601  168.64074373 172.37416382 165.61890535 163.40873027
   168.98683006 149.48186389 172.20815568 172.82947206 173.71584064
   189.42642762 172.79575803 177.00005573 169.24498561 171.55576698
   161.36400372 176.47928342 163.02642822 165.09656415 186.70951892
   153.27990317 165.59289527 180.34566865 189.19506385 183.10723435
   173.48070474 170.28701875 157.24642079 157.9096498  176.4248199 ]
The hist() function will read the array and produce a histogram:
Example
A simple pie chart:
import matplotlib.pyplot as plt
import numpy as np
x =
np.random.normal(170, 10, 250)
plt.hist(x)
plt.show()
Result:
